Full densities instead of point predictions#
[2]:
import numpy as np
import halerium.core as hal
from IPython.display import Image

g = hal.Graph("g")
with g:
    x = hal.Variable("x")

    y = hal.Variable("y")
    y.mean = x * 3. + 1.
    y.variance = 1.

# can be used to visualize the graph on the Halerium platform
#hal.show(g)

x_data = [1.]
dl = hal.DataLinker(n_data=1)
dl.link(g.x, x_data)

model = hal.get_generative_model(g, dl)
prediction_samples = model.get_samples(g.y, n_samples=1000)
prediction_samples = np.array(prediction_samples)[:,0]
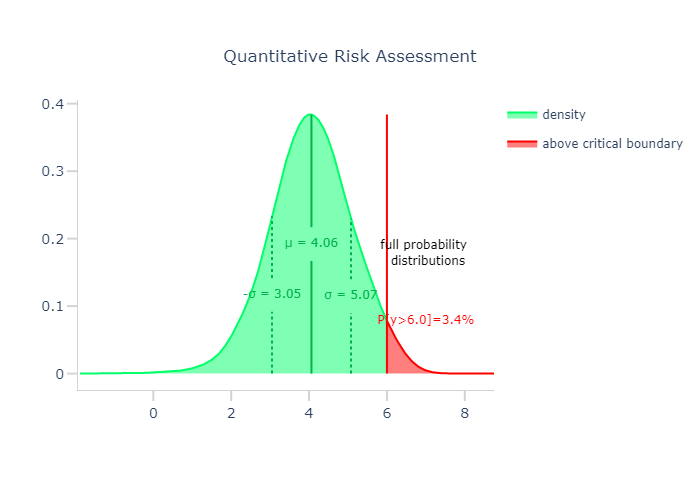
What is the uncertainty estimate good for?#
Imaging there is a hard limit at a output value of 6. Then you have to know what is the likelihood of the real value actually being over 6.
[3]:
boundary=6.
Plotly Visualization#
[4]:
from plots import plot_density_with_boundary

Image(plot_density_with_boundary(prediction_samples, boundary, smoothness=10.))
[4]:
[ ]: