[1]:
import numpy as np
import halerium.core as hal
import matplotlib.pyplot as plt
By using this Application, You are agreeing to be bound by the terms and conditions of the Halerium End-User License Agreement that can be downloaded here: https://erium.de/halerium-eula.txt
Causal Models - the Basics#
Causal Models are models where relationships between parameters have a causal direction.
Correlations and statistics#
Let’s start with correlation and statistics first.
Consider having two parameters \(a\) and \(b\) and some example data for them.
[2]:
cov = [
    [1., 0.7],
    [0.7, 1.]
]
data_ab = np.random.multivariate_normal(np.zeros(2), cov, size=(1000,))
data_a = data_ab[:, 0]
data_b = data_ab[:, 1]
The data for a and b are correlated. Their individual variance is 1.
[3]:
np.corrcoef(data_a, data_b)
[3]:
array([[1.        , 0.70200685],
       [0.70200685, 1.        ]])
[4]:
np.var(data_a), np.var(data_b)
[4]:
(0.9819749563818557, 0.9483082972434826)
[5]:
plt.figure(figsize=(8,8))
plt.scatter(data_a, data_b, alpha=0.5)
plt.xlabel("a")
plt.ylabel("b")
plt.xlim([-4, 4])
plt.ylim([-4, 4])
[5]:
(-4.0, 4.0)
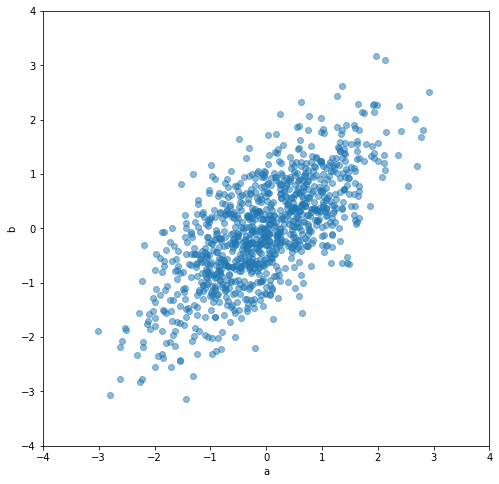
Statistically, all that we care about is the probability distribution \(P(a, b)\). No more. Statistics do not care whether \(a\) causes \(b\) or \(b\) causes \(a\) (or maybe both are caused by another parameter).
With Bayes’ theorem we can construct both splits,
\(P(a,b) = P(a) P(b|a)\)
and
\(P(a,b) = P(b) P(a|b)\).
We can see this by creating two different Bayesian networks
Split 1 - P(a) P(b|a)#
[6]:
graph_1 = hal.Graph("graph_1")
with graph_1:
    hal.Variable("a", mean=0, variance=1)
    hal.Variable("b", mean=0.7 * a, variance=1-0.7**2)
data_from_1_a, data_from_1_b = hal.get_generative_model(graph_1, data=hal.DataLinker(n_data=1000)).get_example(
    [graph_1.a, graph_1.b])
[7]:
graph_1.get_all_variable_dependencies()
[7]:
{'graph_1/a': set(), 'graph_1/b': {'graph_1/a'}}
[8]:
np.corrcoef(data_from_1_a, data_from_1_b)
[8]:
array([[1.        , 0.71458369],
       [0.71458369, 1.        ]])
[9]:
np.var(data_from_1_a), np.var(data_from_1_a)
[9]:
(1.0330448348514882, 1.0330448348514882)
Split 2 - P(b) P(a|b)#
[10]:
graph_2 = hal.Graph("graph_2")
with graph_2:
    hal.Variable("b", mean=0, variance=1)
    hal.Variable("a", mean=0.7 * b, variance=1-0.7**2)
data_from_2_a, data_from_2_b = hal.get_generative_model(graph_2, data=hal.DataLinker(n_data=1000)).get_example(
    [graph_2.a, graph_2.b])
[11]:
graph_2.get_all_variable_dependencies()
[11]:
{'graph_2/b': set(), 'graph_2/a': {'graph_2/b'}}
[12]:
np.corrcoef(data_from_2_a, data_from_2_b)
[12]:
array([[1.        , 0.70663465],
       [0.70663465, 1.        ]])
[13]:
np.var(data_from_2_a), np.var(data_from_2_a)
[13]:
(1.0153531618670686, 1.0153531618670686)
Scatter plot comparison#
[14]:
fig, axs = plt.subplots(1, 2, figsize=(16, 7.5))
for ax, data in zip(axs, [[data_from_1_a, data_from_1_b], [data_from_2_a, data_from_2_b]]):
    data_a, data_b = data
    ax.scatter(data_a, data_b, alpha=0.5)
    ax.set_xlabel("a")
    ax.set_ylabel("b")
    ax.set_xlim([-4, 4])
    ax.set_ylim([-4, 4])
axs[0].set_title("graph_1")
axs[1].set_title("graph_2")
[14]:
Text(0.5, 1.0, 'graph_2')
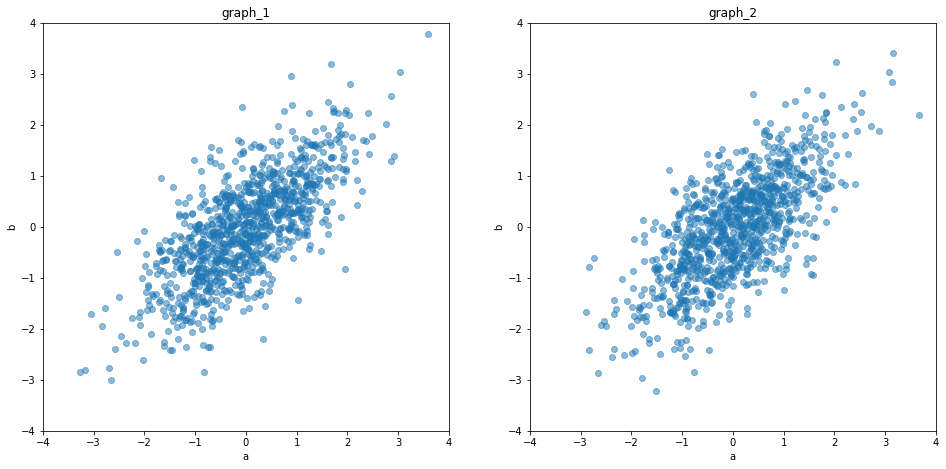
We can see, that both splits produce equal distribution patterns. So the statistics they describe are equivalent.
If both splits are equal, whats the difference?#
Statistically there is no difference. There is only a difference if we interpret the split to be along causal directions.
Split 1: a causes b
Split 2: b causes a
Once we decide for this interpretation and use the “DO” operation to model interventions we get a difference.
The DO operation#
The DO operation cuts all incoming arrows to a parameter.
[15]:
help(hal.do_operation)
Help on function do_operation in module halerium.core.causal_calculus.do:

do_operation(scopetor, variables, inplace=False, strict=True)
    Perform Do operation of variable(s) in scopetor.

    Do operations are required to accurately model interventions.

    The Do operation cuts all dependencies the variables have
    by setting all of the distribution parameters to None.
    This way values that are fed to the variable as data
    can only propagate forwards in the dependency structure.

    Parameters
    ----------
    scopetor : Scopetor (Graph, Entity, Variable)
        The scopetor in which the Do operation is applied.
        Must be a top-level scopetor, i.e. a scopetor without
        a parent scope.
    variables : VariableBase, str or iterable
        The variable(s) to which the Do operation is applied.
        If the variable(s) are not scopees in scopetor,
        their equivalents in scopetor will be located and the
        do operation will be applied to the equivalents instead.
    inplace : bool, optional
        Whether or not to modify scopetor (True) or to leave
        scopetor unchanged and return a modified copy (False).
        The default is False.
    strict : bool, optional
        Only has an effect if inplace=False.
        If True the scopetor has to be self-contained.
        If False not self-contained parts are left out and will be
        set to None in the copied instance.
        The default is True.

    Returns
    -------
    modified_scopetor : Scopetor
        The modified scopetor.
Applied to graph_1, \(P(a)P(b|a)\), the do operation only has an effect if it is applied for the variable b.
[16]:
graph_1.get_all_variable_dependencies()
[16]:
{'graph_1/a': set(), 'graph_1/b': {'graph_1/a'}}
[17]:
hal.do_operation(graph_1, graph_1.a).get_all_variable_dependencies()
[17]:
{'graph_1/a': set(), 'graph_1/b': {'graph_1/a'}}
[18]:
hal.do_operation(graph_1, graph_1.b).get_all_variable_dependencies()
[18]:
{'graph_1/a': set(), 'graph_1/b': set()}
Applied to graph_2, \(P(a)P(b|a)\), the do operation only has an effect if it is applied for the variable a.
[19]:
graph_2.get_all_variable_dependencies()
[19]:
{'graph_2/b': set(), 'graph_2/a': {'graph_2/b'}}
[20]:
hal.do_operation(graph_2, graph_2.a).get_all_variable_dependencies()
[20]:
{'graph_2/b': set(), 'graph_2/a': set()}
[21]:
hal.do_operation(graph_2, graph_2.b).get_all_variable_dependencies()
[21]:
{'graph_2/b': set(), 'graph_2/a': {'graph_2/b'}}
the difference between observation and intervention#
Observation:#
You condition a statistical model (\(P(a,b)\) is a statistical model) to an observation by constructing
\(P(unknown | observed)\).
Say you observe \(a=1\). Then you are asking the question:
\(P(b | a=1)\)
“How does my state of information about \(b\) change if I observe \(a=1\)?”
Intervention:#
You change your causal model (\(P(a= P(b|a)\) can be interpreted as a causal model) to an intervention by constructing
\(P(unknown | DO \ intervention)\).
Say you do \(a=1\) (you set it to 1). Then you are asking the question:
\(P(b | DO \ a=1)\)
“What will happen to \(b\) if I set \(a=1\)”?
Minimal example#
Let’s see the effect on our two graphs
[22]:
a_given = 1.
Graph 1#
Observation:#
[23]:
g = graph_1
hal.Predictor(g, data={g.a: [a_given]})(g.b)
[23]:
array([0.69995633])
Intervention:#
[24]:
g = hal.do_operation(graph_1, graph_1.a)
hal.Predictor(g, data={g.a: [a_given]})(g.b)
[24]:
array([0.7])
For graph 1 there is no difference between intervention and observation because \(a\) is at the beginning of the causal chain.
Graph 2#
Observation:#
[25]:
g = graph_2
hal.Predictor(g, data={g.a: [a_given]})(g.b)
[25]:
array([0.7])
Intervention:#
[26]:
g = hal.do_operation(graph_2, graph_2.a)
hal.Predictor(g, data={g.a: [a_given]})(g.b)
[26]:
array([5.55111512e-18])
For graph 2 there is a fundamental difference between DO \(a=1\) and observe \(a=1\), because \(a\) is caused by \(b\).
Information from an observation travels backwards along causal directions. Information from an intervention only travels forwards.
the InterventionPredictor objective#
The operational chain
g = hal.do_operation(graph_2, graph_2.a)
hal.Predictor(g, data={g.a: [a_given]})(g.b)
is conveniently accessible with the InterventionPredictor objective.
[27]:
hal.InterventionPredictor(graph_2,
                          interventions={graph_2.a: [a_given]})(g.b)
[27]:
array([0.])